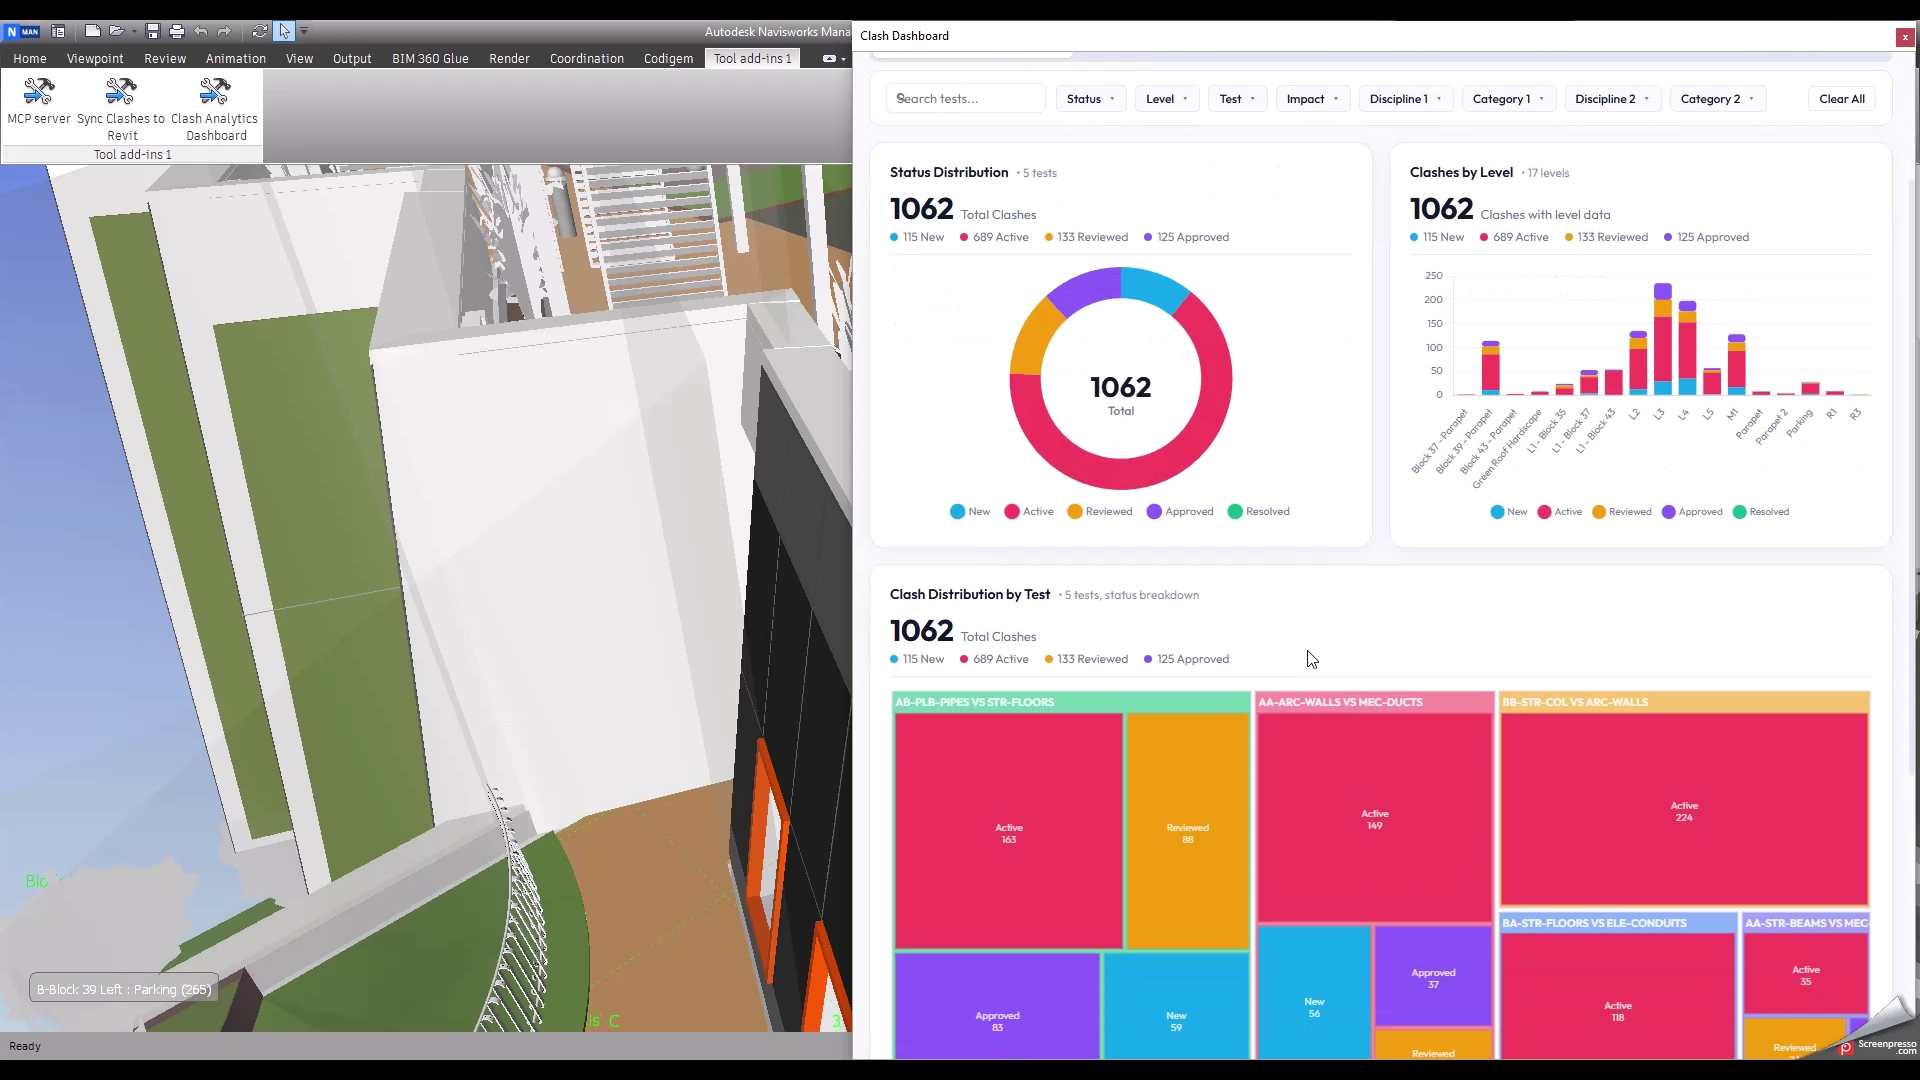
Design Automation Hub
Tools Developers
Version 1.2.0

Multi-D Co-ordination Analytics

Clash analytics at source — inside Navisworks, no export required

Navisworks Manage Navisworks Simulate Coordination Clash Detection Analytics

Screenshots & Demo

Key Features

Multi-Tab Analytics Dashboard

KPI Summary Strip Persistent header cards display Total Clashes, New + Active, Reviewed + Approved, and Resolved counts — animating live as filters are applied.
Overview Charts Four always-visible visuals — status doughnut, clashes by level, test treemap, and clashes by found date — each with a contextual stat strip beneath the card title.
Interactive Multi-Select Filtering A collapsible filter panel slices all overview visuals simultaneously by status, level, clash test, or any parsed name field — with instant chart re-render and no page reload.

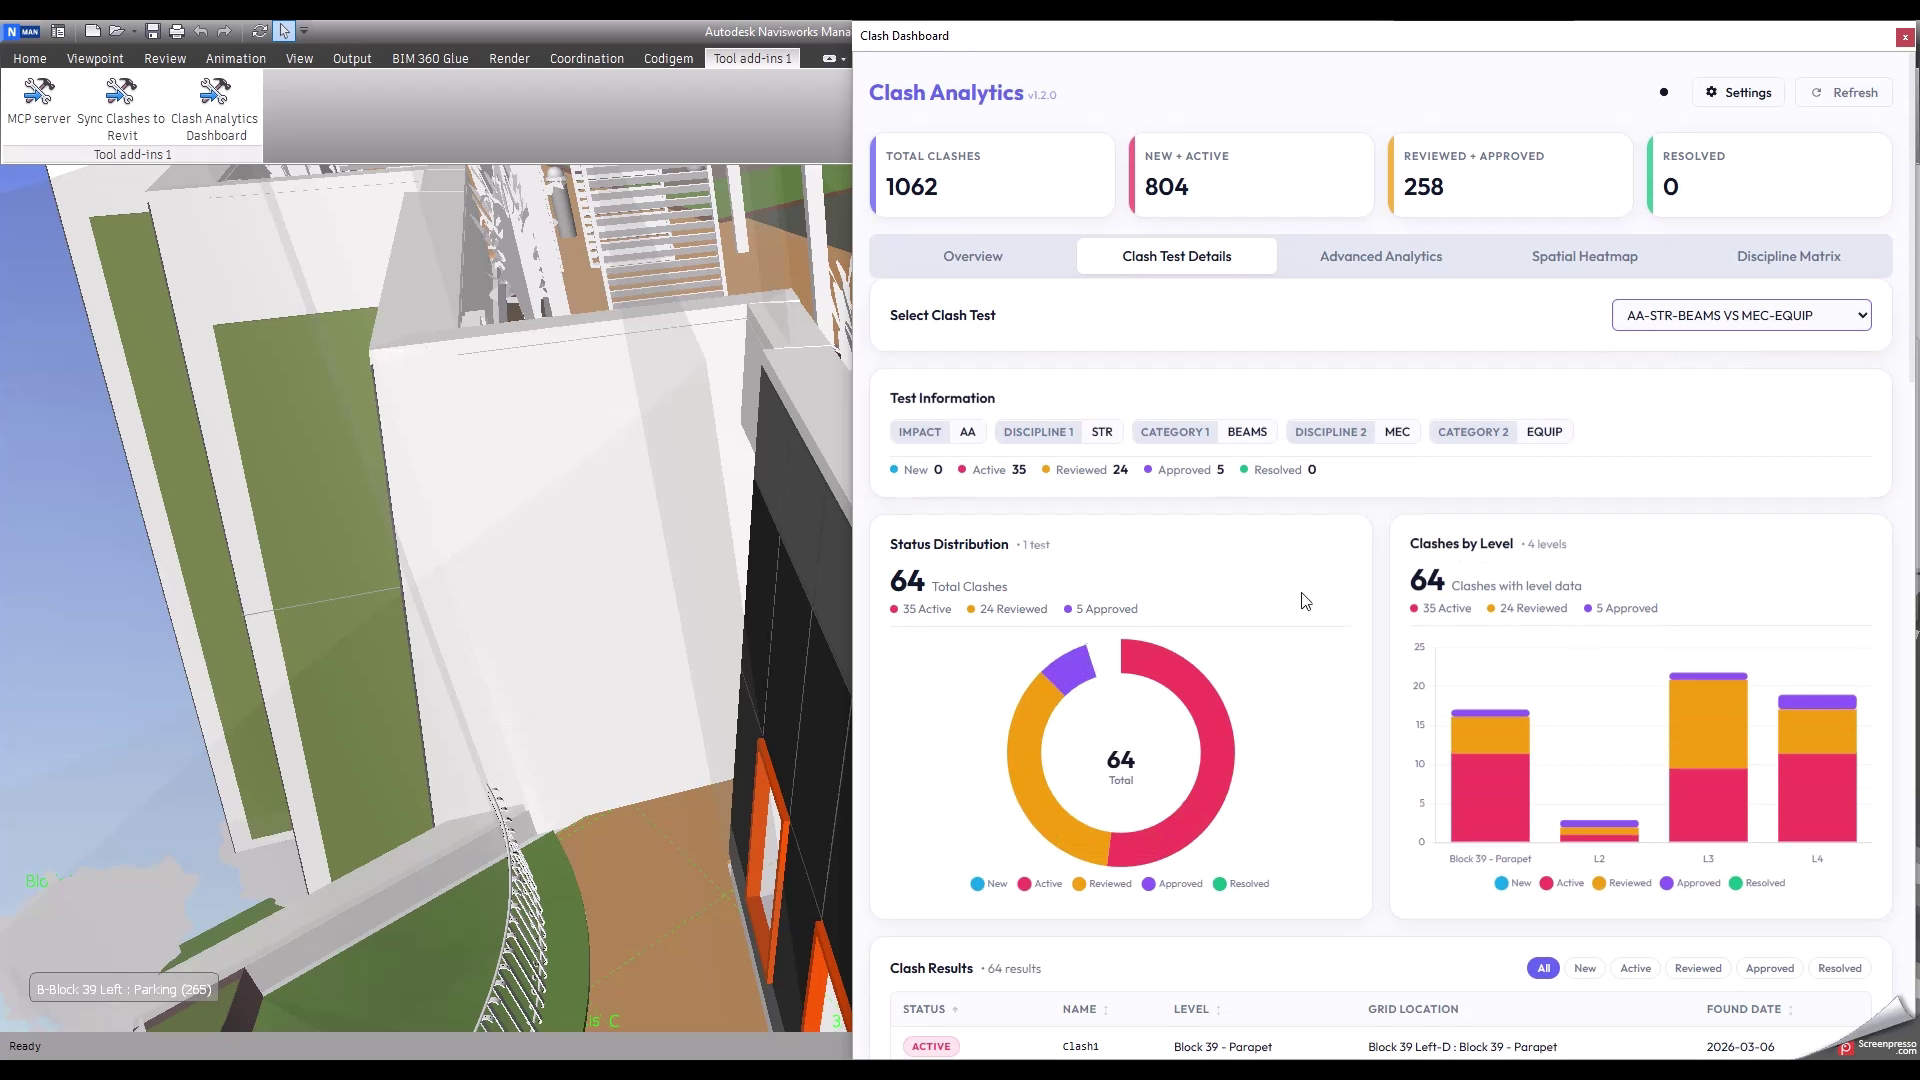
Per-Test Clash Drill-Down

Configurable Test Selector A dropdown lists every compliant clash test. Selecting one immediately renders a status doughnut, a clashes-by-level stacked bar, and a full sortable, paginated clash results table.
Status Filter Pills Inline pill buttons allow rapid isolation of New, Active, Reviewed, Approved, or Resolved clashes within the selected test, with column-level ascending/descending sorting.
Found Date Tracking The clash results table surfaces the CreatedTime field via a runtime reflection fallback chain — guaranteeing compatibility across Navisworks API versions.

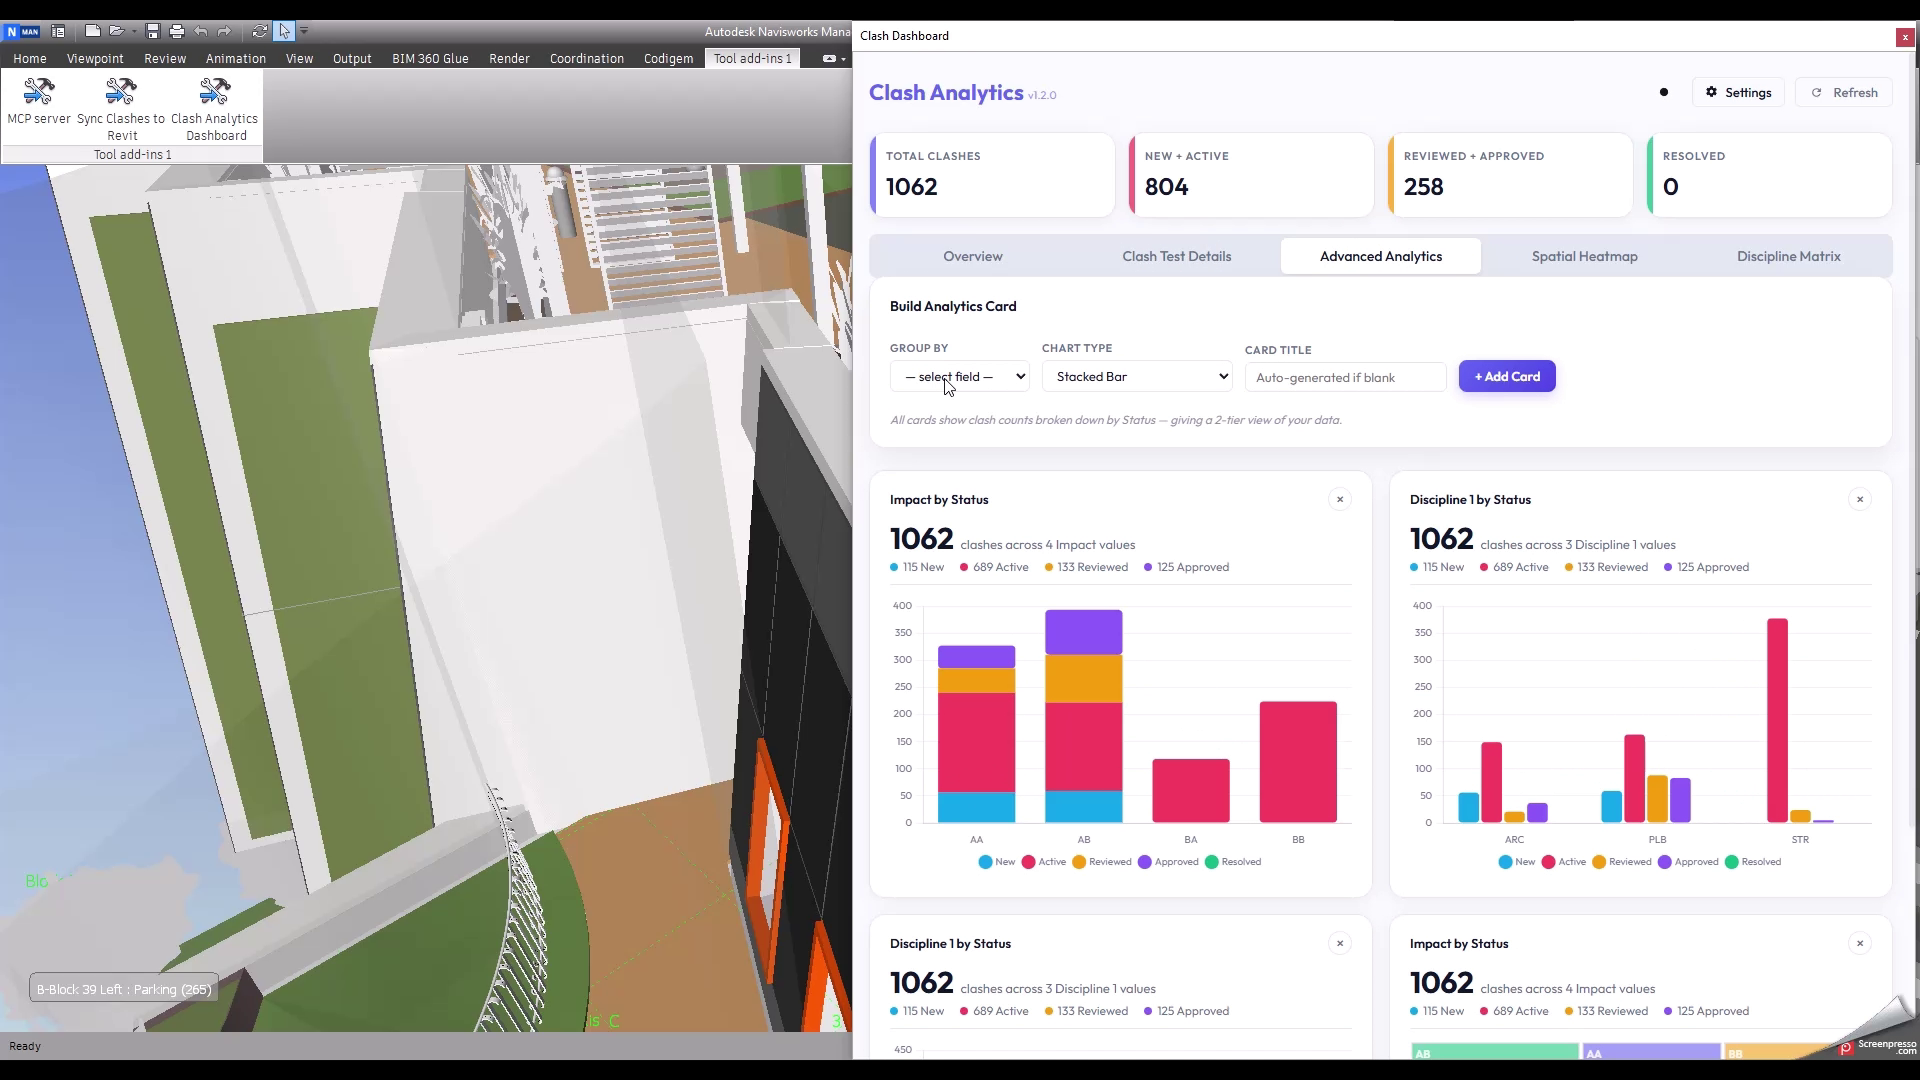
Advanced Analytics Builder

Custom 2-Tier Chart Cards Select any parsed name field as the group-by axis and choose from stacked bar, grouped bar, treemap, bubble, or heatmap to produce a 2-tier breakdown of clash counts by status.
Treemap, Bubble & Heatmap Variants Beyond bar charts: a chartjs-chart-treemap with colour-coded status leaves, a proportional bubble chart, and a chartjs-chart-matrix heatmap with intensity-scaled cells.
Persistent Card State Every generated analytics card displays a grand total and a per-status coloured legend strip. Card definitions persist across sessions via localStorage.

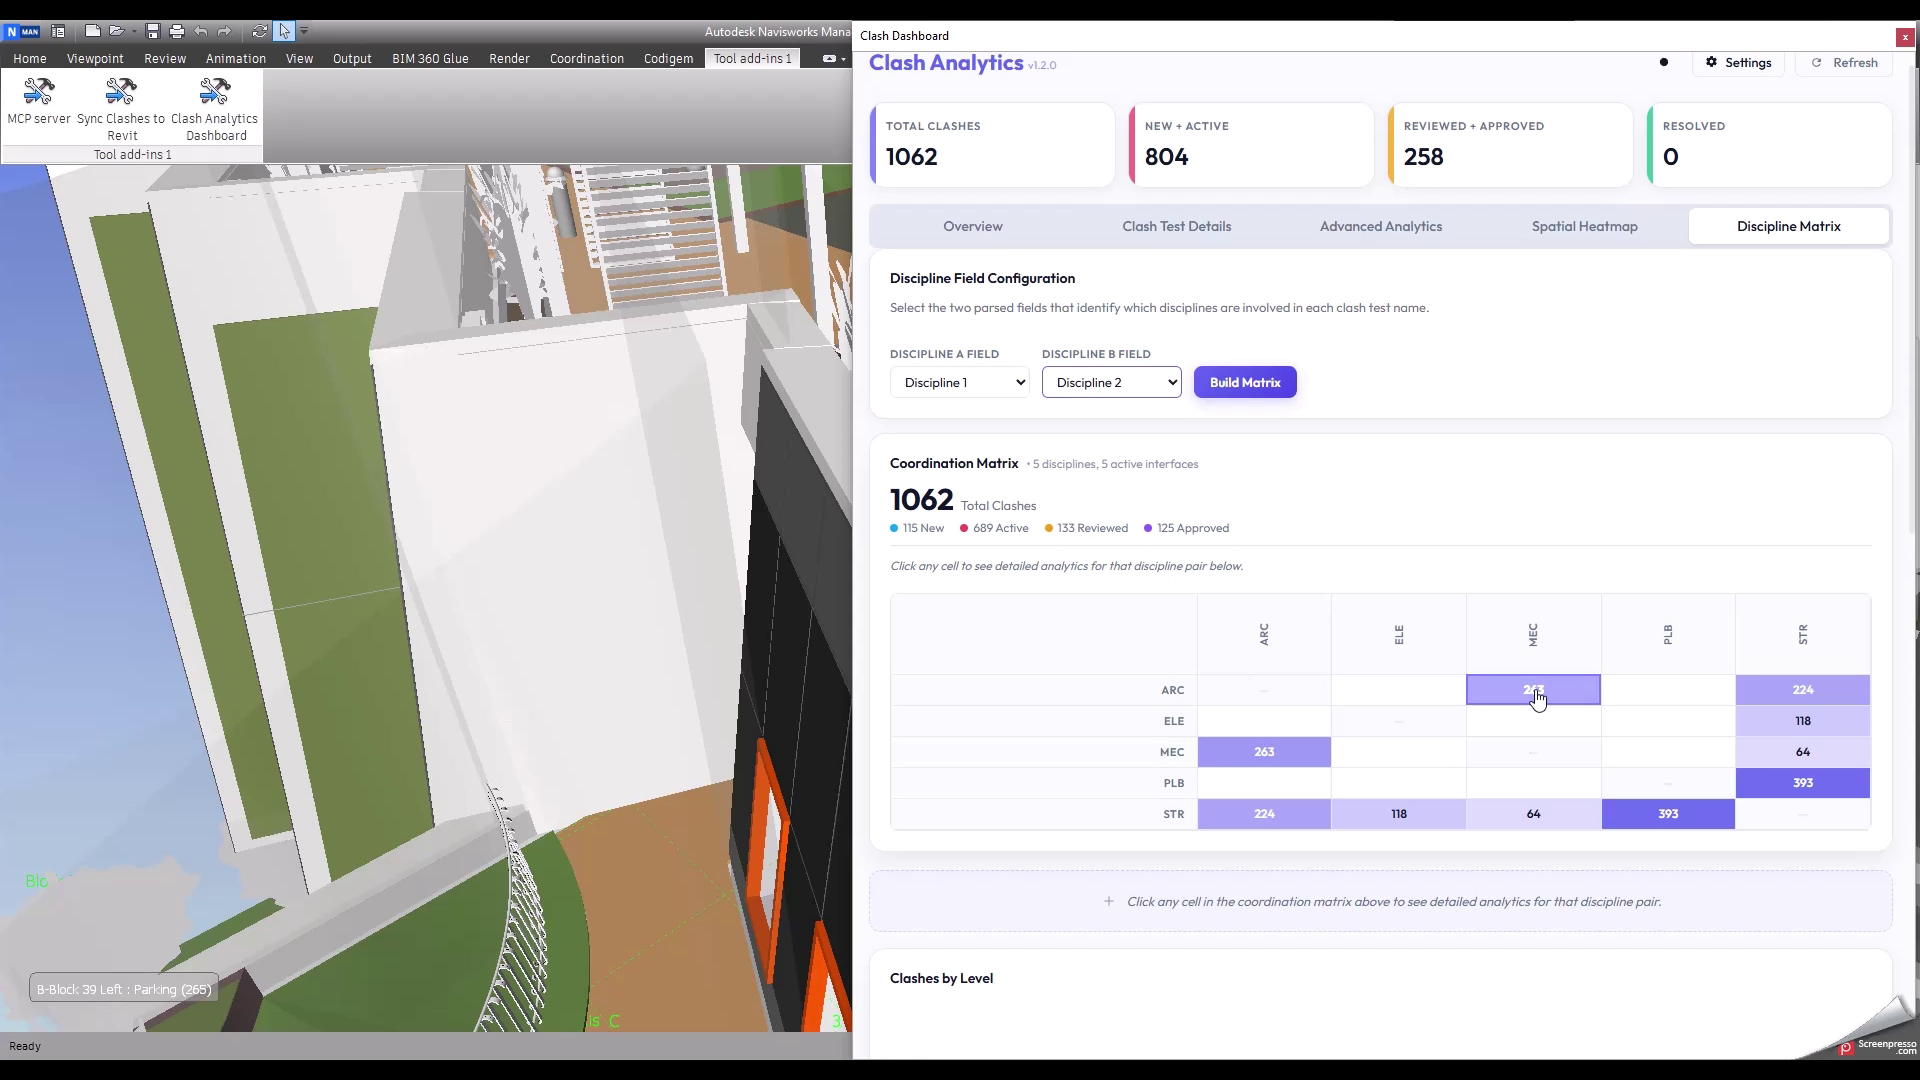
Discipline Coordination Matrix
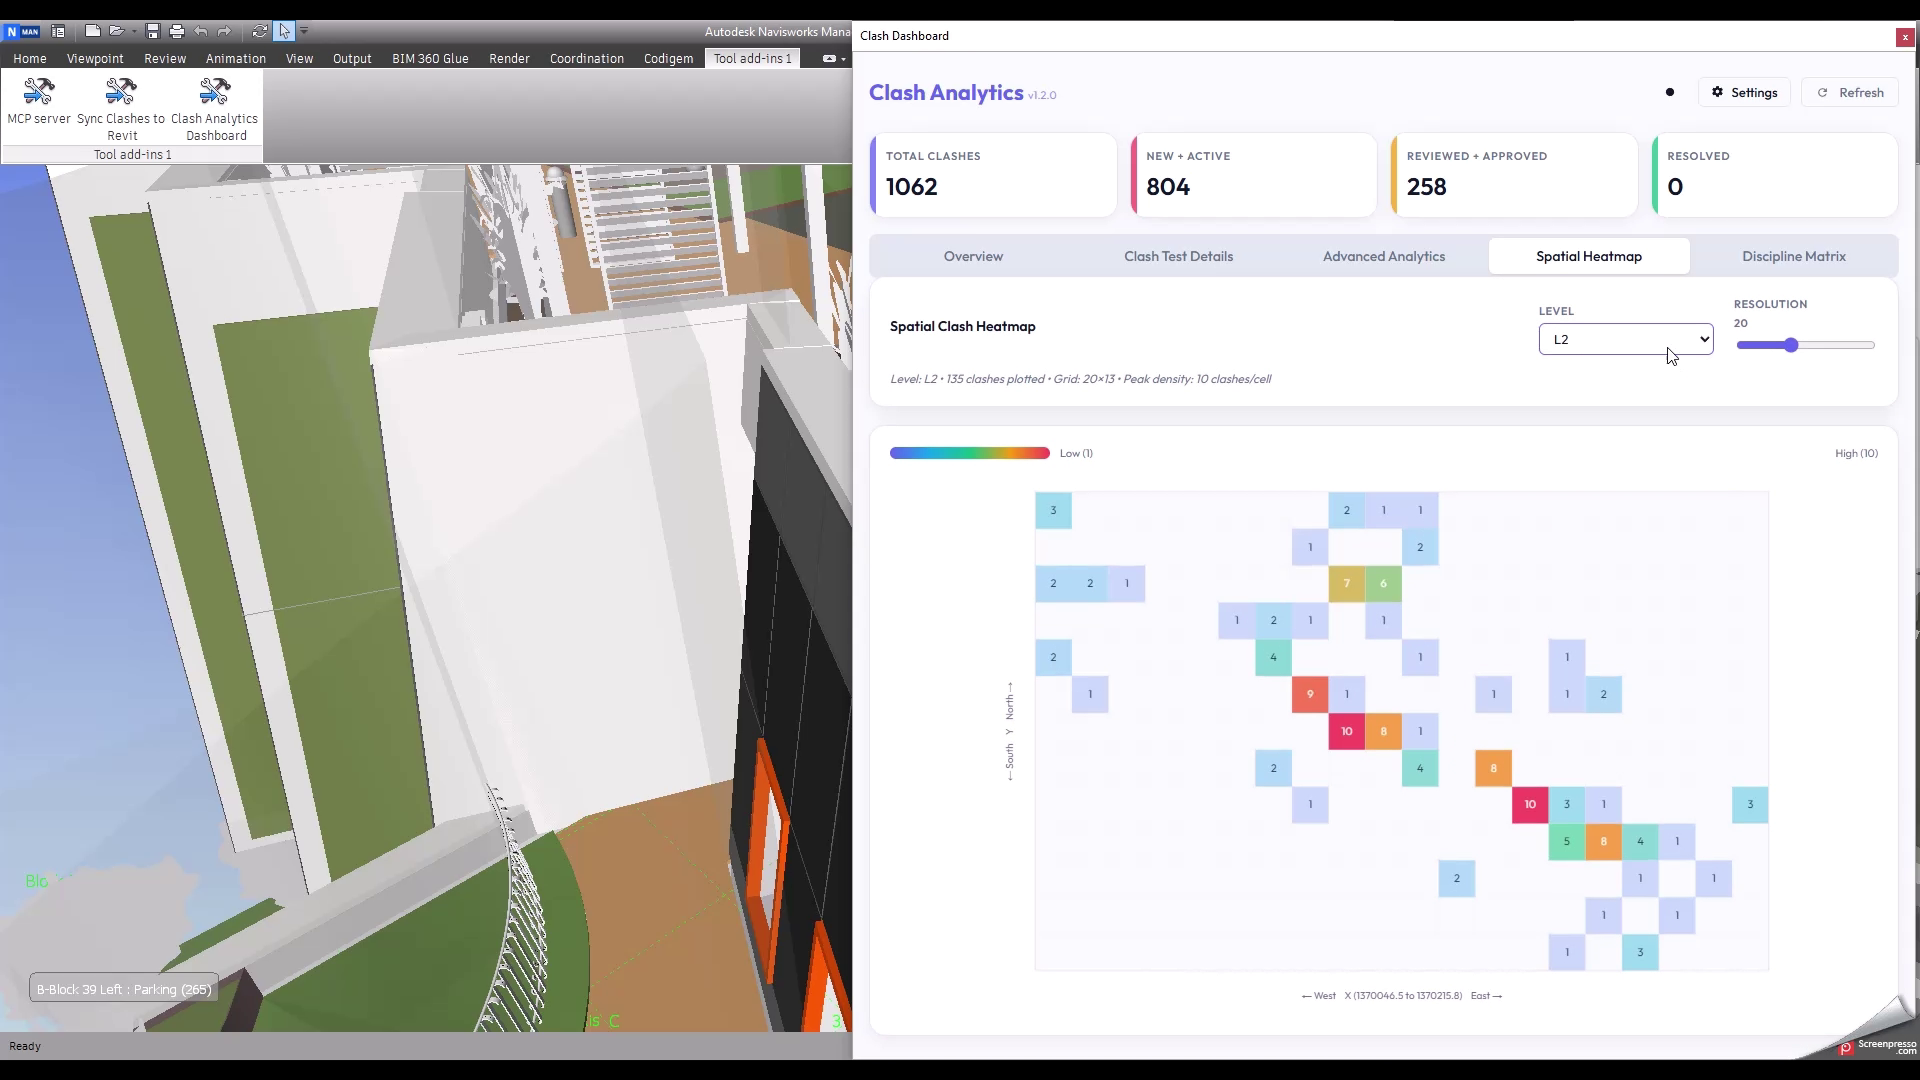
Symmetric N×N Matrix Builds a fully symmetric discipline coordination matrix from any two parsed name fields. Canonical alphabetical sorting ensures Mechanical–Structural and Structural–Mechanical are counted as one interface.
Cell-Click Detail Panel Clicking any cell renders a discipline pair detail section — stat strip, clashes-by-level bar, clashes-by-test treemap, clashes-by-found-date bar, and a ranked test list with status badges.
Intensity-Scaled Colouring Each cell background is rendered at an opacity proportional to its clash count relative to the maximum pair count, making coordination hotspots visible at a glance.

Data Security & Local Processing

Local-Only Analysis All clash data is read directly from the active Navisworks document in memory. No model data or clash results are transmitted over any network connection.
Read-Only Engine The plugin never issues a Navisworks write operation. Model geometry, parameters, and clash results are observed and reported — never modified.
Air-Gapped Ready The dashboard UI is served from a WebView2 virtual host with a strict Content Security Policy. CDN script loads can be replaced with local copies for fully offline deployments.

Solution Architecture

🌐 Client Layer WebView2 / JS
Dashboard Shell & Tab Router Single-page application across five tabs (Overview, Clash Test Details, Advanced Analytics, Spatial Heatmap, Discipline Matrix). Tab state and card definitions persist via localStorage.
Chart Rendering Engine Visualizations built with Chart.js 4.4.7 for bar and doughnut charts, chartjs-chart-treemap for treemap layouts, and a custom Canvas 2D renderer for the spatial heatmap. All chart colours adapt to the active dark/light theme.
Filter & State Engine A dependency-free multi-select filter panel drives real-time cross-chart filtering. All filtering runs client-side against the in-memory clash dataset — no round-trip to C# required after initial data load.
IPC
⚙️ Engine Layer C# / .NET 4.8
Clash Data Extractor Iterates ClashTest objects via the Navisworks Clash API, splitting test names with a Regex.Split pattern built from user-configured separators. Compliant tests are serialized with per-clash status, level, grid location, found date, and XY centroid coordinates.
Reflection-Based Grid & Date Integration Level names are resolved via cached MethodInfo reflection against the active grid system. Clash found dates are resolved through a CreatedTime → FoundDate → CreatedDate fallback chain — insulating the plugin from API surface changes across Navisworks versions.
WebView2 Virtual Host & CSP Dashboard served from the plugin's deployment directory via SetVirtualHostNameToFolderMapping, mapping https://nvclashanalytics.local/ to the UI/ folder. A Content Security Policy restricts script sources and prevents code injection.
Settings & Persistence Manager User configuration (separators, field names) is serialized to settings.json via JavaScriptSerializer. Configuration can be exported and re-imported across machines to ensure consistent naming conventions across teams.
UI Layer (WebView2 / JS)
Plugin Layer (C# .NET 4.8)
Security Boundary

For BIM Coordinators

The discipline matrix surfaces coordination hotspots across all active interfaces at a glance. Cell-click drill-downs provide ranked clash test lists and level breakdowns for focused resolution workflows.

For Technology Leads

A decoupled architecture where the UI is HTML/JS served over a virtual host, allowing front-end iteration without touching the C# plugin. Reflection-based API access insulates the tool from Navisworks version changes.

For Project Managers

Clash analytics are available in context — inside the coordination environment where decisions are made — with no data export or ETL pipeline to Power BI required. KPI cards and status trends are visible the moment the model is open, keeping reporting and resolution in the same workflow.